How to get people to stop littering?

Let’s explore few ways in which one could reduce littering:

1. You could fine people for littering.

2. You could place CCTVs in the area.

3. You could incentivize people for using garbage bins.

4. You could create a social stigma for people who litter.

5. You could make throwing stuff in bins fun.

6. You could use social proof to indicate that a high percentage of people use the bin.

But behavioural scientists did something better in the 2011 Copenhagen study that reduced littering by 46%.

They placed green footprints on the ground, pointing the way to the nearest garbage bin. Simple, low cost, effective Behavioural Design.

India, though is a different story. Usually there are no trash bins in public places, because the trash bins get stolen by people who sell it to make some money, even though they are fixed to the ground with screws. Everything in India has re-sale value.

So Briefcase has created a Behavioural Design solution in the form of non-stealable, waste-segregated, long-lasting, low cost, low maintenance, all weather, endorsable trash bins. But unfortunately, the local government authorities here in Mumbai – the officers from BMC, aren’t interested because of apathy. How can we change their behaviour? Can you help us?

Source: http://www.inudgeyou.com/green-nudge-nudging-litter-into-the-bin/

Towards better fuel efficiency standards (Mint)

Towards better fuel efficiency standards (Mint)

This article first appeared in Mint on 11th December 2018.

For years vehicle makers in India have promoted fuel efficiency by communicating how many kilometres per litre their vehicle delivers. But can people who care about fuel efficiency be able to easily calculate the cost of fuel over the lifetime of the vehicle, or over a long period of, say, five years, when fuel efficiency is measured in kilometres per litre (kmpl)? Consider this. If you were to buy a car that gave 15kmpl and cost ₹5 lakh, and were comparing it to another car that gave 12kmpl and cost ₹4.5 lakh, how would you make the decision? Most people think that the fuel efficiency between a car that gives 15kmpl is not that significantly different from a car that gives 12kmpl. Behavioural science studies find that making such calculations is not intuitive for most people. So they tend to use simple rules of thumb to make quick decisions, which leads to biases and errors.

For example, if you cover a distance of 100km using a car that gives 15kmpl, you’ll be consuming 6.67litres of fuel. If you cover a distance of 100km using a car that gives 12kmpl, you’ll be consuming 8.33litres of fuel. This doesn’t seem like a big difference, right? Now imagine you were comparing litres per kilometre (lpkm) expressed as litres per 100,000km. Then at 15kmpl, you’ll need 6,667litres compared with 8,333litres for the 12kmpl car. That’s a difference of 1,666litres and at ₹100 a litre, it comes to an additional fuel cost of ₹166,600.

Now the same facts, when
reframed in terms of litres per 100,000km, look substantial even though it’s the same fact as 15kmpl compared with 12kmpl. Even if we assume you drive about 10,000km a year, then at 15kmpl, you’ll need 667litres against 833litres for the 12kmpl car. That’s a difference of 166litres and at ₹100 a litre, it comes to an additional fuel cost of ₹16,660 per year. So measuring fuel efficiency in a more tangible manner as lpkm can change the way consumers perceive fuel costs and has the potential to alter their choice altogether. Keeping in mind that fuel costs mostly increase every year, kmpl as a measurement of fuel efficiency becomes even less accurate.

Duke University professors Richard P. Larrick and Jack B. Soll wrote about this way back in 2008. They called it the mpg or miles per gallon illusion. For ease of understanding, we’ll use the metric system used in India and illustrate the mpg illusion in terms of kmpl.

Consider a decision between two cars—a current vehicle and a new vehicle that is more efficient. Which improvement do you think will save the most fuel over 10,000km—(a) an improvement from 10 to 11kmpl; (b) an improvement from 16.5 to 20kmpl; (c) an improvement from 33 to 50kmpl? In most likelihood your answer will be c. But surprisingly, all options save the same amount of fuel over 10,000km: about 100litres.

Equal increases in kmpl are not equal in gas savings. Kilometres per litre can be confusing when thinking about the benefits of improving kmpl. For example, an increase from 10kmpl to 20kmpl produces more savings than does an increase from 20kmpl to 40kmpl.

Behavioural science studies have shown that most consumers do not understand the non-linear nature of the kmpl measure. They tend to interpret kmpl as linear with fuel costs. People tend to underestimate the fuel cost differences among low-kmpl vehicles and to overestimate fuel costs among high-kmpl vehicles.

As a result, buyers may well underestimate the benefits of trading a low-kmpl car for one that is even slightly more fuel-efficient. At the same time, they may overestimate the benefits of trading a high-kmpl car for one that has even higher kmpl.

Consumers don’t have that much motivation, time and attention to understand this issue. Even hardcore auto enthusiasts are likely to be making intuitive comparative judgements based on kmpl and are likely to make poor recommendations.

That’s why the researchers Larrick and Soll came up with the behavioural design solution of gpm (gallons per mile) or, in our case, litres per kilometre measured over meaningful distances. Think about which is more useful to know: How far you can drive on a litre of fuel? Or, how much fuel will you use while owning a car?

Kmpl answers the first question and lpkm answers the second question. Also, gpm or lpkm gets directly translated to cost of fuel for the consumer.

In US, the Environmental Protection Agency and department of transportation revised the fuel economy label to also include gpm (gallons per 100miles) and fuel cost over five years compared to the average, in addition to mentioning the mpg. In Europe, fuel consumption labels communicate litres/100km. In India, we’re still following kmpl, but it is difficult to compare kmpl of one car with another that costs a bit more, but has a higher kmpl number or compare a car that costs a bit less and has lower kmpl number.

What matters is how much money we will be spending on fuel over the lifetime of driving the car. And that can directly be calculated by lpkm. Not just that, if appliances like refrigerators can have behavioural design nudges like the energy consumption star ratings, why can’t vehicles get a fuel consumption star rating based on lpkm?

We owe this article to not just Duke University professors Richard P. Larrick and Jack B. Soll, but also to behavioural economist stalwarts Richard Thaler and Cass Sunstein because of whom we chanced upon the work of the former professors.


What it takes to be an innovator

What it takes to be an innovator

Most of us tend to think that innovators are born geniuses. It’s in their blood. Either you have it or you don’t. But reality is anything but that. Innovation like anything else is a habit that can be designed. Just the way a company called Brasilata has done.

Brasilata is a US$ 170 million manufacturing firm from Brazil that makes various kinds of steel cans. Manufacturing may seem boring but Brasilata is one of the most innovating companies in Latin America. For example in 2012, employees submitted 1,71,916 ideas – an average of 170.4 ideas per employee! Many of the suggestions led to the development of new products. The decision regarding approval and implementation of these ideas is made most of the time by the front line.

For instance, Brasilata came up with a new approach for steel cans designed to carry flammable liquids to meet UN standards. These cans needed to withstand a drop from 4 feet. Most manufacturers did this by thickening the metal layers, which ended up using more raw material. But Brasilata’s employees created a new steel can inspired by car bumpers that collapse on impact. The new steel can be deformed on impact, reducing stress on critical seam. This also reduced the amount of steel used.

In another instance, when the Brazil government rationed energy in 2001 due to severe energy crisis, Brasilata’s employees reduced its energy consumption by 35% and even resold extra energy saved to other companies.

Innovation is so embedded in the employees that two employees came up with a suggestion of eliminating their own jobs! Beat that.

Is innovation in their blood? Are they born with it or has been it designed?

Let’s see what their founders put in place for this to happen. To begin with the employees are called ‘inventors’. It isn’t simply feel good language. When they join the company they are asked to sign an innovation contract. It challenges them to come up with ideas for better products, improve production processes and squeeze costs out of the system. Procedures have been made for them to submit their ideas. Brasilata distributes 15% of its net profits amongst its inventors.

I have no doubt that the journey would have been a difficult one. It probably took a while for employees to become good at inventing. And initially employees might have even felt like imposters with themselves being called inventors. The founders would have created an expectation of failure – not the failure of the mission, but of failure on route.

And yes I forgot to mention that the idea of the two employees of eliminating their job was accepted. Their explanation was that they had eliminated their job positions to increase company profitability and this would in turn be distributed to all; as mentioned previously 15% of Brasilata net profits are shared by the employees. But the two were placed in a new roles because Brasilata has a no dismissal policy. In the opinion of the chief executive officer “job security functions as a safety net which enables the trapeze artist to perform to his best ability without risking his life.”

Source: Brasilata


What to do when people don’t see the need to change

What to do when people don't see the need to change

A lot of times people don’t see the need to change. Even if they intellectually understand that change is required, rarely does it materialize. We mean haven’t you ever faced a situation where you have made a powerful case via a powerpoint presentation filled with charts and graphs and inspiring quotes, and everyone in the room understood exactly what you meant and even noded their heads with enthusiasm, but nothing really happened after that? No? Then you must be so damn good looking! For the rest of us, things needn’t be this hard. There can be a better way as described by the following two examples.

Jon Stegner worked for a large manufacturing company and figured there was an opportunity to cut purchasing costs that would result in savings of $1 billion over five years. But to reap these savings, a big process shift would be required and for that to happen the bosses would need to believe in the opportunity and for the most part, they didn’t.

Let’s face it, if you were in his place the natural and most likely thing you would have done is make a presentation with all the savings data, the cost-cutting protocols, a recommendation for supplier consolidation and the logic for central purchasing.

But instead, Stegner hired a summer intern and asked him to identify all the types of gloves used in all the company’s factories and find out what the company was paying for it. They found that the factories were purchasing 424 kinds of gloves, using different suppliers, and all were negotiating their own prices. The same pair of gloves that cost $5 at one factory cost $17 at another.

Stegner piled and tagged each of the 424 kinds of gloves and invited all division presidents to visit the Glove Shrine. The presidents were like, “We really buy all these different kinds of gloves?” “This is crazy” “We’re crazy”. “We’ve got to fix this”. The company changed its purchasing process and saved a lot of money. (Source: The Heart of Change by John Kotter and Dan Cohen)

Another example is of Robyn Waters who worked at Target as a Trend Manager at a time when Target was a ‘discounter’ and was lagging the trends and not starting them. That was Robyn Waters’s mandate. But the merchandizers in various departments were traditionally copycats.

For a time in retail, trendy clothing was neutral in color. Everything was gray, white, khaki, tan or black. Then, one season color exploded in the retailers in London and Paris. So Waters needed to get her merchants excited about color. But Target had an analytical, numbers driven culture and the merchants would review the past few year’s sales and see that the color hadn’t sold.

So she poured a bag full of bright colored M&Ms on the glass table creating cascades of turquoise and hot pink and lime green. Merchants went “Wow” and she’d say, “See, look at your reaction to color”. (Source: Interview of Robyn Waters by Chip Heath)

In both cases, the change agent was a single employee with not much resource. Both created the change by dramatizing the need for change in a tangible way.


Ascent + INK talk on Behavioural Design (Video)

Was a privilege to talk at Harsh Mariwala’s Ascent + INK conclave, along with industry stalwarts like Harsh Mariwala, Chairman, Marico and Uday Kotak, Executive Vice Chairman, Kotak Mahindra Bank.

Topics included irrational behaviour of masses, doctors, air travellers, car drivers; inefficacy of campaigns like Swachh Bharat at changing behaviour; why our government and companies in India need to adopt behavioural design; public behaviour change; Bleep, People Power and how Nudge units are being implemented by governments around the world.


Behavioural solutions for road safety (Mint)

Behavioural solutions for road safety

This editorial article first appeared in Mint on 21st March, 2017

Making roads better should reduce the number of accidents. Yet that’s exactly the opposite of what’s happening in India. Despite measures being taken by the government on improving roads, there has been a continuous increase in road crash deaths since 2007, with a brief annual reduction in 2012. Between 2010 and 2015, incidence of road accidental deaths increased by an annual average rate of 1.2%. There were over 500,000 road accidents in 2015, up from 489,000 in 2014. More than 500,000 people were injured in road accidents in 2015, up from 493,000 in 2014. A total of 146,000 people died in road accidents in 2015, up from 139,000 in 2014. According to the National Crime Records Bureau, out of 146,000 deaths, only 0.8% of the cases were due to lack of road infrastructure.

Road safety is not just about creating infrastructure. It is about designing behavioural solutions that take human biases and irrational behaviour into consideration. When the roads are smooth, wide and empty, drivers are likely to speed. If the car being driven is big and tough, the driver feels much safer compared to driving say, a small hatchback. That makes drivers over-compensate and take undue risks. Regular speed limit signs are ineffective at getting drivers to slow down, because drivers don’t choose the speed based on speed limit signs. Rather, drivers simply go with the flow depending upon the width and smoothness of the road and traffic conditions.

To get drivers to reduce speeding, there have been several effective behavioural design nudges implemented around the world. At the curve of Chicago’s Lake Shore Drive and Oak Street, a series of horizontal white stripes have been painted on the road, that get progressively narrower as drivers approach the sharpest point of the curve, giving them the illusion of speeding up, and nudging them to tap their brakes.

According to an analysis conducted by the city’s traffic engineers, there were 36% fewer crashes in the six months after the lines were painted compared to the same six-month period the year before. Similar behavioural design nudges are now being applied in China and Israel to curb speeding.

In another trial in the UK conducted by Norfolk County Council, more than 200 trees were planted on the approach roads in north Norfolk which had a history of speeding problems. Results found that drivers reduced their speed by an average of 2 miles per hour. Again, as the car approached the village, the trees, planted closer and closer together, gave the impression that the vehicle was moving faster. This encouraged the motorists to slow down.

In another experiment in the US, the Virginia department of transportation painted zigzag white markings instead of the familiar straight dashed lines, to caution drivers approaching the road-crossing intersection used by pedestrians and bicyclists. They found that zigzag markings slowed average vehicle speeds and increased motorists’ awareness of pedestrians and cyclists. They also noted that the effects of the behavioural design didn’t wear off once motorists became used to it—they still slowed down a year after installation.

Building infrastructure like traffic signals doesn’t mean people will always follow them. But creating behavioural design nudges like displaying the seconds remaining for the traffic signal to turn green, is likely to reduce the number of people who break the signal. Such behavioural design takes into account that people are usually in a rush.

Rationally speaking, people shouldn’t be breaking signals because they wouldn’t be acting in their self-interest by putting themselves in harm’s way. But human behaviour is not rational. Drivers honk even when there is no way that honking could clear a traffic jam. Even when the signal is still red, there are drivers who honk. Therefore, rational ways of changing behaviour like educating people or creating awareness-based campaigns are ineffective. What’s effective at getting people to reduce honking is “bleep”—a red button on the dashboard of a car that beeps and flashes when the driver presses the horn. To switch off the red button, the driver has to press it. This behavioural design nudge breaks the habit of drivers’ honking because now each time drivers want to honk, “bleep” makes them deliberate whether they should honk or not. Bleep has been shown to reduce drivers honking by 61% in a six-month and 3,800km-long experiment in Mumbai.

Behavioural design needs to be applied at pedestrian crossings at traffic-signal junctions. At various traffic junctions, there are two signals in view—one signal placed just after the zebra crossing and the second signal on the other side of the junction once you’ve crossed it. That makes drivers keep inching forward, not stopping at the zebra crossing and thus not allowing pedestrians to cross. So to get cars to stop at the zebra crossing, only one traffic signal needs to be placed just before the zebra-crossing stripes begin, so that drivers have no option but to stop to get a view of the one and only traffic signal.

It’s time authorities stopped relying on ineffective money-draining campaigns, driver education and enforcement of laws. Instead, we should test simple, practical, scientific behavioural design nudges to improve road safety.


Designing effective public policy (Mint)

Designing effective public policy

This article first appeared in Mint’s editorial column ‘Their View’ on 21st Dec, 2016

Behavioural science should be used to design effective evidence-based public policy

For the most part, designing policy has meant passing a law, a sanction or penalty that imposes a fine or imprisonment to effect desired behavioural change or action. It assumes that the connection between law and actual behavioural is linear. It assumes that people are aware of the law, realize it applies to them, that people weigh the costs of breaking the law with the risk of being caught, overcome the temptations of the moment, in favour of willpower and self-discipline, and comply.

However, in spite of alcohol being prohibited in Gujarat, Nagaland, and Bihar, it is still readily available in these states, and has helped create a network of bootleggers, liquor mafia, spurious liquor, and a complicit police. There are fines for not adhering to traffic laws like honking unnecessarily or not stopping the car before a zebra crossing, but they are far from being effective in getting people to take the desired action. There is a fine for littering, but our roads are strewn with litter. Even when retailers charge for plastic bags, its consumption continues to grow. Fines and sanctions curb people’s fundamental right to choose and, therefore, are met with resistance and are often counterproductive.

A nudge, on the other hand, is a way of encouraging or guiding behaviour without mandating, instructing, sanctioning or monetarily incentivizing. It leaves people with the freedom of choice and yet guides them to act positively. Instead of shutting down choices, a nudge changes behaviour with a lighter touch, a more empirical and behaviourally-focused approach to policymaking.

A pioneer in designing effective public policy by using behavioural design nudges is the Behavioural Insights Team (BIT) or the “Nudge Unit” of the UK. It was started in 2010, headed by David Halpern and advised by Richard Thaler, with the backing of then Prime Minister David Cameron. Like any new idea, it had its sceptics in government. But over the first two years itself, it demonstrated the value behavioural science could bring in designing policy, based on empirical methods, that led to better outcomes, easier services for the public and most importantly saved government money.

BIT conducts dozens of experiments in the form of randomized controlled trials or rapid low-cost trials in areas such as healthcare, tax, energy conservation, crime reduction, employment and economic growth. Among some of its popular work is how it helped the tax department collect more taxes. BIT worked with the tax department to send out different versions of letters to people who owed tax to test systematically if changing the wording based on behavioural science literature would make a difference. They tested whether adding a single sentence such as “most people pay their tax on time” would boost repayment rates. And it did. By several percentage points, bringing in tens of millions of pounds. It’s because social norms are powerful in getting people to take action. Wording can make a big difference in behaviour change—imagine 3G, 4G and Wi-Fi being reworded as “radiation”.

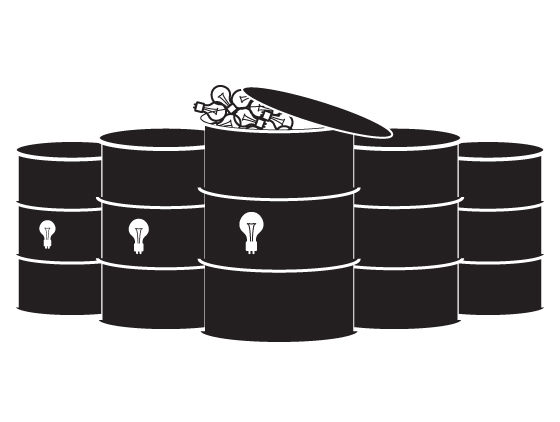
Another experiment was about motoring fines. It showed that adding an image of the owner’s car to the ticket, captured by the camera, made the owner significantly more likely to pay unpaid car tax. In a third experiment, they encouraged people to insulate their lofts or attics. Insulation reduces heat loss, reduces energy bills and costs much less compared to the overall monetary benefits, yet people weren’t insulating their lofts. They tested two offers—an attic-clearance service and extra discounts. The attic-clearance scheme was more than three times more popular than extra discounts because the biggest issue was attic clearance rather than cost.

In the area of employment, getting the unemployed to think about what they could do in the next two weeks, instead of asking what they had done in the previous two weeks, significantly increased the number of unemployed who got work faster, trimming millions of days off benefits. In behavioural science, such a nudge is termed “implementation intention”.

In the area of pensions, employees now automatically joined the company-sponsored pension scheme by default but still had the option of opting out. So now the default was automatic enrolment rather than actively choosing to do so, making good behaviour easy. That led to more than five million new pensioners. Behavioural science studies by David Laibson, Shlomo Benartzi and other behavioural scientists show that changing the default beats financial education hands down.

Other BIT experiments have showed how simple behavioural design nudges can reduce carbon emissions, increase organ donations, increase quit-rates of smoking, reduce missed medical appointments, help students finish their courses, reduce discrimination and boost recruitment. And like the examples mentioned above, they are low cost, simple and scalable.

India has hundreds of problems to solve that require effective public-behaviour change—waste segregation, energy conservation, reducing road accidents, fuel conservation, cleanliness, adherence to medication, tobacco addiction, open defecation, reducing crime, hand-washing, tax evasion, alcoholism, etc. Instead of relying on law, fines, threats and monetary incentives, why not apply behavioural science and test simple, low-cost behavioural design nudges to see what works? Test, learn and adapt. After all, evidence-based policy is the best policy.


Organizations have bad habits too (and they can be changed)

Organisations have bad habits too (and they can be changed)

“Individuals have habits; groups have routines. Routines are the organizational analogue of habits”, wrote Geoffrey Hodgson, who spent a career examining organizational patterns. And as we know habits can be good or bad. Not just that, they can be dangerous, because while performing routines, employees yield decision-making to a process that occurs without actually thinking, automatically – habit.

Paul O’Neill who is known to have turned around the fortunes of a company called Alcoa – Aluminum Company of America understood this really well. Alcoa was going through troubled times when it hired Paul O’Neill as CEO. Investors, executives and workers were unhappy. Quality was suffering. And competitors were stealing customers and profits.

O’Neill believed that some habits have the power to start a chain reaction, changing other habits as they move through an organization. These are keystone habits. The habits that matter the most. These are the ones that, when they start to shift, dislodge and remake other patterns.

So O’Neill figured he needed a focus that everybody – unions and executives – could agree as being important, so that he could bring people together. He said, “So I thought everyone deserves to leave work as safely as they arrive, right? You shouldn’t be scared that feeding your family is going to kill you. That’s why I decided to focus on: changing everyone’s safety habits.” So he made SAFETY his top priority and set an audacious goal for a manufacturing company of that size: zero injuries.

The approach was brilliant because unions had been fighting for safety rules for years. And managers were happy since injuries meant low productivity and low morale. What most people didn’t realize was that O’Neill’s plan for getting zero injuries entailed the most radical realignment in Alcoa’s history.

According to O’Neill’s safety plan, any time someone was injured, the unit president had to report it to him within 24 hours and present a plan for making sure the injury never happened again. The reward: people who got promoted, were those who embraced and cracked this system.

If unit presidents had to contact O’Neill within 24 hours with a plan, they needed to hear about the accident from their vice presidents as soon as it happened. So vice presidents had to be in constant communication with floor managers, who in turn needed to get workers to raise warnings as soon as they saw the problem. Meanwhile in those 24 hours everyone in the chain had to generate a list of suggestions for their immediate superior, so that there was an idea box full of possibilities for the unit president to choose from. This changed the company’s rigid hierarchy as communication had to make it easy for the lowliest worker to get an idea to the loftiest executive, as fast as possible.

As Alcoa’s safety patterns shifted, productivity skyrocketed, quality improved, costs came down and autonomy improved. If molten metal was injuring workers when it splashed, then the pouring system was redesigned, which led to fewer injuries. It also saved money because Alcoa lost less raw materials in spills. If a machine kept breaking down, it was replaced, which meant there was less risk of broken gear snagging an employees arm. It also meant higher quality products because, as Alcoa discovered, equipment malfunctions were a chief cause of subpar aluminum.

By the time O’Neill retired after 13 years, Alcoa’s annual income was five times larger than before he arrived. Its market capitalization had risen by $27 billion. Alcoa became one of the safest companies in the world – the keystone habit that changed it all.

Source: The Power of Habit by Charles Duhigg


Related Posts Plugin for WordPress, Blogger...