Towards better fuel efficiency standards (Mint)

Towards better fuel efficiency standards (Mint)

This article first appeared in Mint on 11th December 2018.

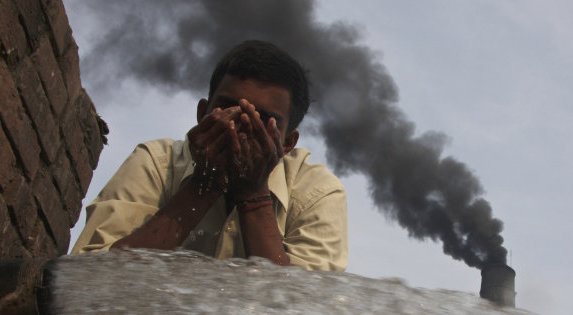
For years vehicle makers in India have promoted fuel efficiency by communicating how many kilometres per litre their vehicle delivers. But can people who care about fuel efficiency be able to easily calculate the cost of fuel over the lifetime of the vehicle, or over a long period of, say, five years, when fuel efficiency is measured in kilometres per litre (kmpl)? Consider this. If you were to buy a car that gave 15kmpl and cost ₹5 lakh, and were comparing it to another car that gave 12kmpl and cost ₹4.5 lakh, how would you make the decision? Most people think that the fuel efficiency between a car that gives 15kmpl is not that significantly different from a car that gives 12kmpl. Behavioural science studies find that making such calculations is not intuitive for most people. So they tend to use simple rules of thumb to make quick decisions, which leads to biases and errors.

For example, if you cover a distance of 100km using a car that gives 15kmpl, you’ll be consuming 6.67litres of fuel. If you cover a distance of 100km using a car that gives 12kmpl, you’ll be consuming 8.33litres of fuel. This doesn’t seem like a big difference, right? Now imagine you were comparing litres per kilometre (lpkm) expressed as litres per 100,000km. Then at 15kmpl, you’ll need 6,667litres compared with 8,333litres for the 12kmpl car. That’s a difference of 1,666litres and at ₹100 a litre, it comes to an additional fuel cost of ₹166,600.

Now the same facts, when
reframed in terms of litres per 100,000km, look substantial even though it’s the same fact as 15kmpl compared with 12kmpl. Even if we assume you drive about 10,000km a year, then at 15kmpl, you’ll need 667litres against 833litres for the 12kmpl car. That’s a difference of 166litres and at ₹100 a litre, it comes to an additional fuel cost of ₹16,660 per year. So measuring fuel efficiency in a more tangible manner as lpkm can change the way consumers perceive fuel costs and has the potential to alter their choice altogether. Keeping in mind that fuel costs mostly increase every year, kmpl as a measurement of fuel efficiency becomes even less accurate.

Duke University professors Richard P. Larrick and Jack B. Soll wrote about this way back in 2008. They called it the mpg or miles per gallon illusion. For ease of understanding, we’ll use the metric system used in India and illustrate the mpg illusion in terms of kmpl.

Consider a decision between two cars—a current vehicle and a new vehicle that is more efficient. Which improvement do you think will save the most fuel over 10,000km—(a) an improvement from 10 to 11kmpl; (b) an improvement from 16.5 to 20kmpl; (c) an improvement from 33 to 50kmpl? In most likelihood your answer will be c. But surprisingly, all options save the same amount of fuel over 10,000km: about 100litres.

Equal increases in kmpl are not equal in gas savings. Kilometres per litre can be confusing when thinking about the benefits of improving kmpl. For example, an increase from 10kmpl to 20kmpl produces more savings than does an increase from 20kmpl to 40kmpl.

Behavioural science studies have shown that most consumers do not understand the non-linear nature of the kmpl measure. They tend to interpret kmpl as linear with fuel costs. People tend to underestimate the fuel cost differences among low-kmpl vehicles and to overestimate fuel costs among high-kmpl vehicles.

As a result, buyers may well underestimate the benefits of trading a low-kmpl car for one that is even slightly more fuel-efficient. At the same time, they may overestimate the benefits of trading a high-kmpl car for one that has even higher kmpl.

Consumers don’t have that much motivation, time and attention to understand this issue. Even hardcore auto enthusiasts are likely to be making intuitive comparative judgements based on kmpl and are likely to make poor recommendations.

That’s why the researchers Larrick and Soll came up with the behavioural design solution of gpm (gallons per mile) or, in our case, litres per kilometre measured over meaningful distances. Think about which is more useful to know: How far you can drive on a litre of fuel? Or, how much fuel will you use while owning a car?

Kmpl answers the first question and lpkm answers the second question. Also, gpm or lpkm gets directly translated to cost of fuel for the consumer.

In US, the Environmental Protection Agency and department of transportation revised the fuel economy label to also include gpm (gallons per 100miles) and fuel cost over five years compared to the average, in addition to mentioning the mpg. In Europe, fuel consumption labels communicate litres/100km. In India, we’re still following kmpl, but it is difficult to compare kmpl of one car with another that costs a bit more, but has a higher kmpl number or compare a car that costs a bit less and has lower kmpl number.

What matters is how much money we will be spending on fuel over the lifetime of driving the car. And that can directly be calculated by lpkm. Not just that, if appliances like refrigerators can have behavioural design nudges like the energy consumption star ratings, why can’t vehicles get a fuel consumption star rating based on lpkm?

We owe this article to not just Duke University professors Richard P. Larrick and Jack B. Soll, but also to behavioural economist stalwarts Richard Thaler and Cass Sunstein because of whom we chanced upon the work of the former professors.

A pretty face can even sell high interest rate loans

A pretty face can sell high interest rate loans

That’s what happened in South Africa when a bank wanted to push personal loans to fifty thousand of its customers. In a field experiment conducted by Bertrand, Karlan, Mullainathan, Shafir and Zinman, the bank crafted several variations of the loan offer letter.

They tested lots of variations in features of a direct mailer sent to 53,000 potential customers with formal jobs in urban and semi-urban parts of South Africa. Some of the features varied were proposing uses of the loan, presenting more examples of loans – like loan amount, tenure, rate, payable amount, etc.; displaying interest rates in different ways, showing competitors rates and showing a picture of a pretty woman.

The letters included different interest rates (ranging from 3.25% to 7.75% per month); some featured comparison to a competitor’s rate; others a lucky draw – ten cell phones up for grabs each month; still others a photo of either a man’s or a woman’s pleasant, smiling face. The versions were randomly assigned and mailed off.

To start with the obvious one – customers were significantly more likely to apply for low-rate loans. But two other factors were influential in getting customer response, though they had nothing to do with the terms of the loan. One – the number of loan examples. Mailers with four examples of loans attracted far fewer applicants than mailers with just one example. Presenting more options drove away customers. Showing one loan example instead of four attracted as many additional applicants as dropping the interest rate by about a third!

Second, adding a picture of a pleasant, smiling face of a woman had the same effect on men as lowering the loan’s interest rate by 25%. Surely no customer would say that his decision to borrow boiled down to the picture in the corner of the mailer, but the data was there to prove it. Having a picture of a pretty woman logically doesn’t make for a better financial offer, but what happened is that the men were attracted to the woman and therefore signed up for the loan. And interestingly customers (in South Africa) didn’t respond any differently when the race of the woman was varied. The effect of a woman’s photo on women didn’t make much of a difference as it did on men.

No man would consciously sign up for a higher interest loan just because the offer letter had a picture of a woman on it, right? But male customers made errors in evaluating the attractiveness of the loan because they didn’t focus on the important data. Instinct took over. That’s why its best to A/B test Behavioural Design solutions to know which ones work. Without testing, you will never know what works, what doesn’t and which could be the best solution.

Source: Marianne Bertrand, Dean Karlan, Sendhil Mullainathan, Eldar Shafir and Jonathan Zinman – What’s advertising content worth? A field experiment in the consumer credit market – Quarterly Journal of Economics 125 (1), February 2010.

Do movie reviews really have an impact on us?

Do movie reviews really have an impact on us?

Though each one of our tastes vary, there are a couple of common factors that help us decide whether we should watch the latest movie getting released – cast, director, producer, writer, music including the item song (we’re referring to Bollywood), the vibe of the promotional video, posters, interviews, etc. But what about the movie’s reviews? Do you feel it really has any impact on whether you decide to watch the movie or not? And whether you end up liking the movie or not?

Let’s try and understand this phenomenon via an interesting experiment done by Dan Ariely, Baba Shiv and Ziv Carmon. In this experiment they used a beverage that claims to increase mental acuity – SoBe and developed a 30 min word jumble test. The first group of students took the test without drinking any SoBe. The second group was told about the intelligence enhancing properties of SoBe. These students were charged $2.89 for the SoBe. A third group was exactly like the second group, but were told they would be given a discount on SoBe and would be charged only 89 cents.

The group that drank the full charge SoBe performed slightly better than the group that didn’t drink SoBe. And the group that drank the discounted SoBe performed worse than the full charge SoBe group and the SoBe-free group. The value the students attributed to the SoBe made the difference in their scores. Says Dan Ariely, one of the researchers and author of Predictably Irrational, “Expectations change the reality we live in. When you get something at a discount, the positive expectations don’t kick in as strongly. And once we attribute a certain value to something, it’s very difficult to view it in any other light.”

That suggests that if we shape our view of a movie by hearing or reading the opinion of critics, then the value the critic gives, becomes our expectation and therefore reality. So if the review is good, then we’re likely to like the movie and if its bad we may decide not to see it or if we happen to see it, we’re more likely to not like it.

Now why is it that so many movies do well in India inspite of not getting good reviews? A possible explanation is that those people don’t read reviews by critics, but instead follow reviews of other like-minded people, whose tastes in turn differ vastly from the critics. Either way social proof works.

Source: Placebo Effects of Marketing Actions: Consumers May Get What They Pay For – Baba Shiv, Ziv Carmon, and Dan Ariely – Journal of Marketing Research 383 Vol. XLII, 383–393 (November 2005)

Why we need a new label for ‘Climate Change’ (HuffPost)

Why we need a label for 'Climate Change'

This article of ours first appeared in Huffington Post on 17th July, 2017.

Nineteen of the G20 countries have affirmed their commitment to the Paris climate agreement, which sets guidelines for each participating country to mitigate global warming. Sponsored by the United Nations, it aims to slow the rise in global temperatures. The US is the lone outlier on climate change while India remains committed on the issue of climate change “as per its own values and requirements.”

On the face of it, climate change seems like a problem that may be happening but is still some time away in the future. So perhaps it can be handled sometime in the future. After all there are so many urgent problems facing our country—poverty, malnutrition, black money, terrorism, lack of infrastructure, etc. Plus, there is this diffused sense of responsibility because it’s affecting almost every country in the world. So the question arises, why should India take the lead to tackle climate change? After all it’s the developed countries that are responsible for much of the industrialisation that’s causing global warming and climate change. But what really matters is which countries are facing and will continue to face the maximum harm from climate change. And India is right on top of that list according to research by the Notre Dame Global Adaptation Initiative. The group measures vulnerability by considering the potential impact of climate change on six areas: food, water, health, ecosystem service, human habitat and infrastructure.

Climate change is a wicked problem. As this New Scientist article points out:

“It provides us with no defining qualities that would give it a clear identity: no deadlines, no geographic location, no single cause or solution and, critically, no obvious enemy. Our brains scan it for the usual cues that we use to process and evaluate information about the world, but find none. And so we impose our own.

It is wide open for interpretation causing constant uncertainty. Climate scientists say people don’t get the science about the environment. Environmentalists say political will is being corrupted by vested commercial interests. Commercial interests deny climate change. Individual minds are left confused.

But not only do vested economic interests inhibit reforms, our individual brains are not geared to deal with the problem. Climate change is global, complex, somewhat abstract problem, and occurs in a time frame of decades, all of which make it difficult for people to respond appropriately. Costs are short term, benefits are long term and perceived as uncertain, though in fact benefits are massively greater than the costs of action now. Take survival, for instance. But people suffer from loss aversion—the tendency to fear losses more than we love gains. So it’s challenging for us to give up our aspirations to consume and enjoy the pleasures of consumption now, in order to reap the benefits of reversing climate change.

According to the National Oceanic and Atmospheric Association, US Department of Commerce, January 2017’s average global temperature was the third highest for January in the 1880-2017 record, behind 2016 (highest) and 2007 (second highest). The extent of polar sea ice on 4 December, 2016 was about 3.84 million square kilometers (1.48 million square miles) below the 1981-2010 average, according to U.S. National Snow and Ice Data Center satellite measurements. That’s roughly the size of India melted away because of rising global temperatures. The increase in temperature, heatwaves, storms, floods and disruption of weather patterns is being felt by everyone, but it’s still somehow not enough to get everyone to take the necessary desired action. Why?

To begin with, climate change is a soft term, moderate and fuzzy. It could do with re-labeling as “climate disaster”. Climate disaster creates a stronger sense of threat and generates a greater sense of urgency. It brings up vivid images to the mind of typical disasters—storms, floods, wildfires, droughts, etc. So people are more likely see it as harming them and their family, and more likely to see it happening now. Several behavioural science studies have shown evidence that when words are re-labeled it makes a huge difference in people’s behaviour. Imagine 3G, 4G and wifi being reworded as “radiation”.

However, education on “climate disaster” is not enough. It needs to be made more tangible for everyone to act upon it. We need to create behavioural design nudges in our everyday lives that enable everyone to effectively contribute in reducing climate disaster in a tangible, concrete way. For example, just like the Bureau of Energy Efficiency has created an energy saving star rating system for household appliances like air conditioners, refrigerators and washing machines, we need to have an encompassing “climate disaster” star rating system for each and every product and service we consume. Fewer the stars, more the damage caused to the planet. Higher the stars, the better it is for the planet. For example, amongst food items, chicken would get a higher star rating than beef because cows let out methane as they digest food, a potent greenhouse gas, 25 times as powerful as carbon dioxide. And beef requires 28 times more land to produce than chicken and 11 times more water. Vegetarian plant-based food would get the highest star rating in comparison. The “climate disaster” star rating system will, in turn, nudge manufacturers to ensure their products and services have a high star rating. That means relying on renewable sources of energy, efficient use of resources, efficient emissions and better waste management. Sure it can be complicated to work out such a rating for all products and services, but if done, we could have a shot at surviving ‘climate disaster’.

Consumer and employee behaviour (Bajaj Finance)

Consumer and Employee behaviour (Bajaj Finance)

Last week we spoke at Bajaj Finance on applying behavioural science to improve sales conversions, new product adoption, product portfolio, choice architecture, pricing strategies, employee behaviour change, productivity, performance management systems, learning and team collaboration.

One of the questions asked during the Q&A was what’s the difference between data science and behavioural science and what’s the role of both in business. We answered the question with the example of Uber. To make sure you can hire an Uber within couple of minutes of booking one and to make sure the cab arrives at the exact location around the time promised, Uber must be applying incredible amount of data science – matching user’s data with driver’s data and of course so much more we don’t understand as behavioural scientists. When Uber would use surge-pricing too, they would apply data science to incentivise drivers to reduce customer’s waiting time. But it didn’t go down well with anyone. So Uber changed its tactic from surge-pricing (1.8x) to upfront-pricing (Rs. 167). With upfront-pricing customers no longer feel its unfair because they are informed about the exact fare at the time of booking prior to the trip, which is a certain fixed amount and that puts customers at ease, even though in peak times Uber indicates that fares are higher due to higher demand. On the other hand, surge-pricing (1.8x) pinched people a lot more. But now with upfront-pricing, Uber is still able to charge a surcharge, but without pinching people as much, thereby improving customer experience. Uber’s upfront-pricing is an example of Behavioural Design.

If you are a retailer, you ought to know who’s pregnant!

if you are a retailer, you ought to know who is pregnant

Amongst big retail chains, it is common knowledge that people’s buying habits are more likely to change when they go through a major life event. Like getting married or moving into a new house or losing or changing a job. But life’s biggest event for most people is having a baby. And new parents’ habits are more flexible at that moment than any other time in an adult’s life. So for companies, pregnant women are gold mines.

I’m seeing a lot of my friends become new parents and they buy lots of stuff – diapers, wipes, cots, blankets, bottles, cribs, the list is endless. Retailers figure out that once sleep-deprived moms and dads start purchasing baby stuff, then they’ll also buy groceries, towels, underwears and whatever is easily available. To new parents, easy matters the most.

New parents are so valuable that companies like Walt Disney, P&G, Fisher-Price, etc in the US, have lots of giveaway programs aimed at new parents in hospitals itself. But for a retail chain like Target, approaching moms in maternity wards can be a bit too late. So Target began marketing to them before the baby arrives.

How did they do that? Target has a baby shower registry and that helps them identify some pregnant women. Target has analyzed shopping patterns of soon-to-be-mothers by looking at their due dates provided by them and linking the shopping done across pregnancy trimesters. Target figured that lots of people buy lotion, but women on the baby registry were buying unusually large quantities of unscented lotion in the beginning of their second trimester. In the first twenty weeks many pregnant women bought lots of vitamins. Lots of shoppers buy soap and cotton balls every month, but when someone buys lots of them, in addition to hand sanitizers and lots of washcloths, a few months after buying scent-free lotions and vitamins, it signals that they are getting closer to their delivery date. Whereas if someone bought a stroller, but nothing else, they probably bought it for a friend’s baby shower.

Target is one of the best retailers at predictive analytics. But they figured that they would need to use this information wisely. After all women can be upset if they received an offer making it obvious Target knew their reproductive status. So how do they get their coupons and offers into expectant mothers’ hands without making it appear they were spying on them?

Target sends specially designed mailers to customers, by mixing in all the ads for things pregnant women would never buy with offers meant for them, so that the baby ads look random. So there’s an ad for a lawnmower next to diapers. Wineglasses next to the offer on infant clothes. As long as the pregnant women thinks she hasn’t been spied on, she’ll use the coupons. And that’s because she assumes that everyone else has also got the same mailer too.

Emotions hugely affect decision-making

Emotions hugely affect decision-making

We’ve all experienced how we like to shop when we’re feeling down. While that says a lot about our buying behaviour, we never imagined that emotions played a huge role in our selling behaviour as well. This phenomenon is explained by an interesting study below.

Behavioural scientist Jennifer Lerner and her colleagues induced either sadness or no emotion in participants by having them view different film clips. Those assigned to the sadness-inducing condition watched a movie clip from The Champ, which featured the death of a boy’s mentor; following that, they were asked to write a brief paragraph about how they’d feel if they’d been in the situation themselves. Those in the no-emotion condition watched an emotionally neutral film clip featuring fish and then wrote about their day-to-day activities. Afterward, half the participants were asked to set a price to sell some highlighters and the other half were asked to set a price to buy the same highlighters.

Turned out that sad buyers were willing to purchase the item for around 30% more than emotionally neutral buyers. Here’s the interesting part. Sad sellers were willing to part with the item for around 33% less than emotionally neutral sellers! Researchers also found that the participants had no idea that they had been so deeply affected by the residual feelings of sadness.

Behavioural scientists Christopher Hsee and Yuval Rottenstrich argue further that in emotionally charged situations we become less sensitive to the magnitude of numbers – we are more likely to pay attention to the simple presence or absence of an event. We get persuaded by offers when we shouldn’t be. Like when we’re got our eyes set on a new beauty (car) and if the difference between the price of the car and what we’re willing to pay for it is say Rs. 3 lakh – a good salesperson will manage to persuade us by throwing in one or two additional items free like a mirror lock or steering lock, whose value is realistically nowhere near Rs. 3 lakhs.

Lesson for negotiations, buying and selling decisions – examine how you feel and put off the decision until you’re feeling emotionally neutral.

Source: Lerner, A. Small and G. Lowenstein – Heart strings and purse strings: carryover effects of emotions on economic decisions – Psychological Science, 15:337-41 (2004)

Related Posts Plugin for WordPress, Blogger...